Financial Command Center
A local finance dashboard that keeps every account in one store and flags what to act on.
Running on my Mac. Every screen here comes from a demo copy on generated data.
9 rules that turn the totals into findings, each with a reason and an action
- Where
- Personal project
- Role
- Solo build
- Built with
- Next.js, TypeScript, SQLite (node:sqlite), Lunch Money API, SimpleFIN, MCP
What I made
I built it in Next.js and TypeScript over a local SQLite store. Four adapters share one schema, so switching data provider changes one file, and each sync writes one report that the dashboard, a terminal summary and an MCP server all read.
- AdaptersLunch Money, SimpleFIN, Stripe or demo data
- Ingestupsert, prune deleted rows, categorise from history
- SQLite storeone normalized schema, on the machine
- Metrics and advisornet worth, burn, caps, 9 rules
- Reportone JSON file of aggregates
- Dashboard, CLI, MCPthree readers of the same report
4data-source adapters behind one schema
34tests on generated demo data
6MCP tools over the store, from reading the report to running a sync
What came out of it
The advisor
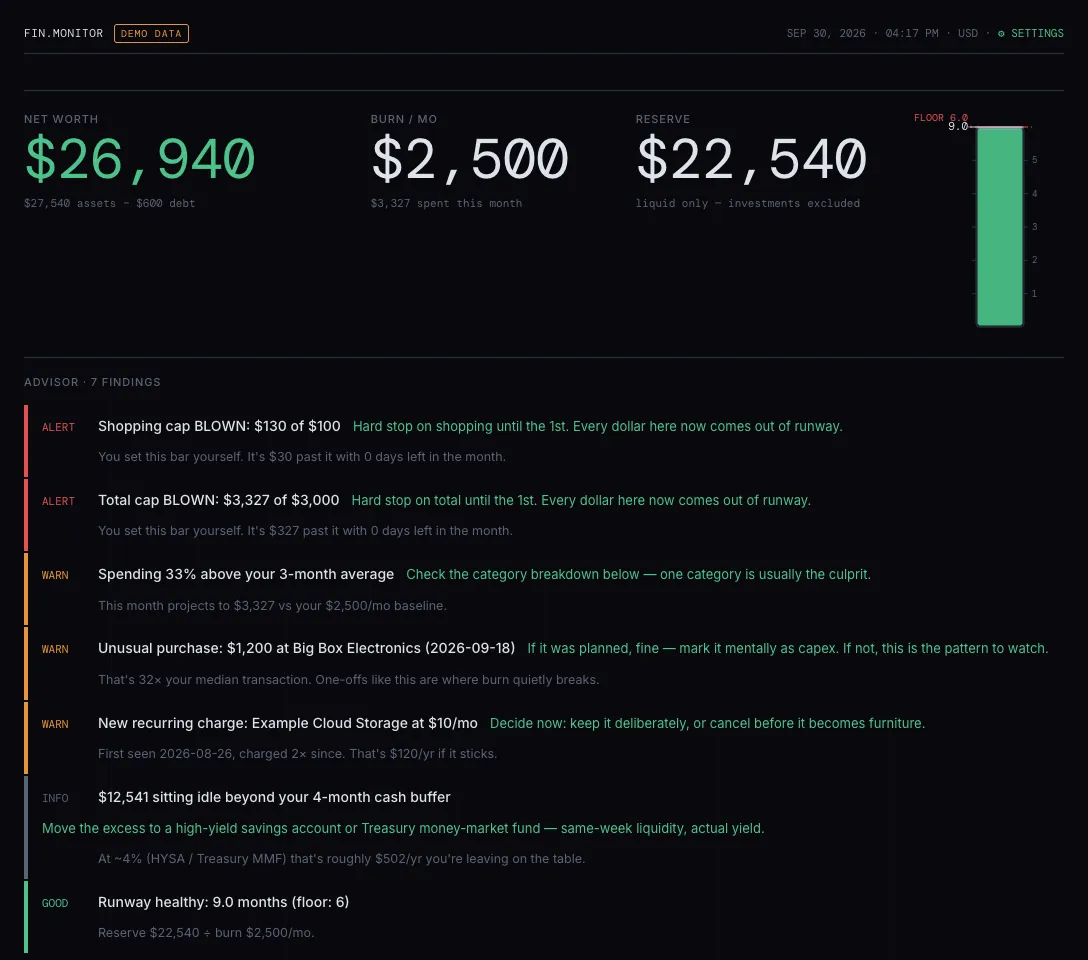
On the demo data it raised 7 findings, among them cap alerts, a spending spike and a recurring charge that had just appeared. Each one gives a reason and an action.
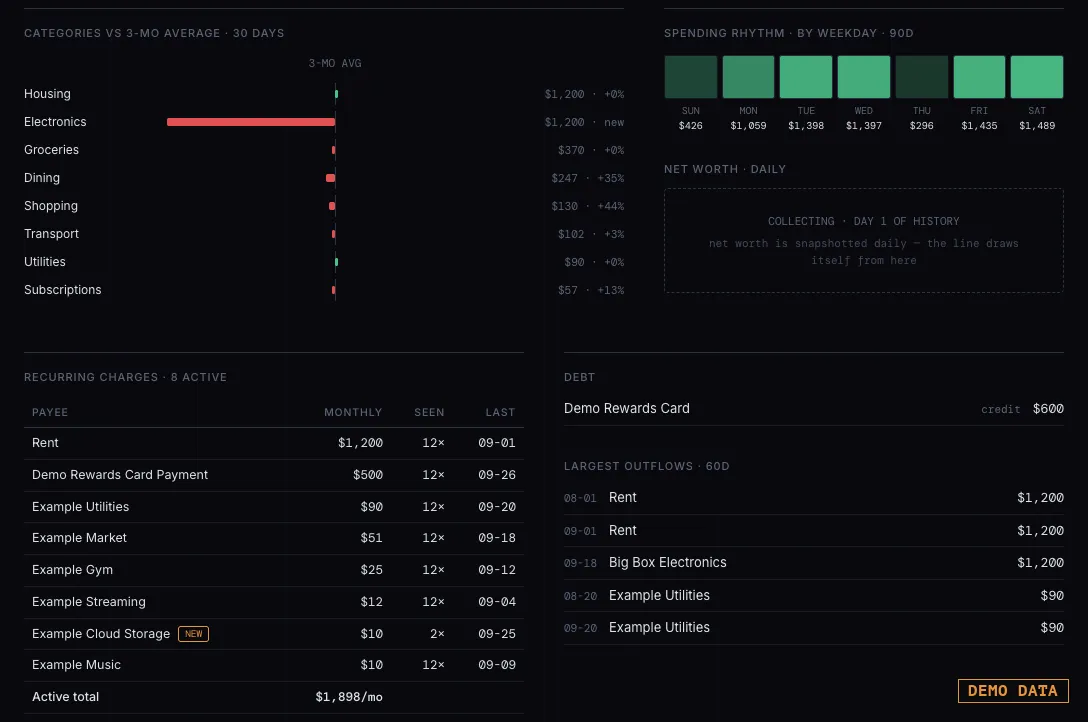
Caps, cash flow and patterns
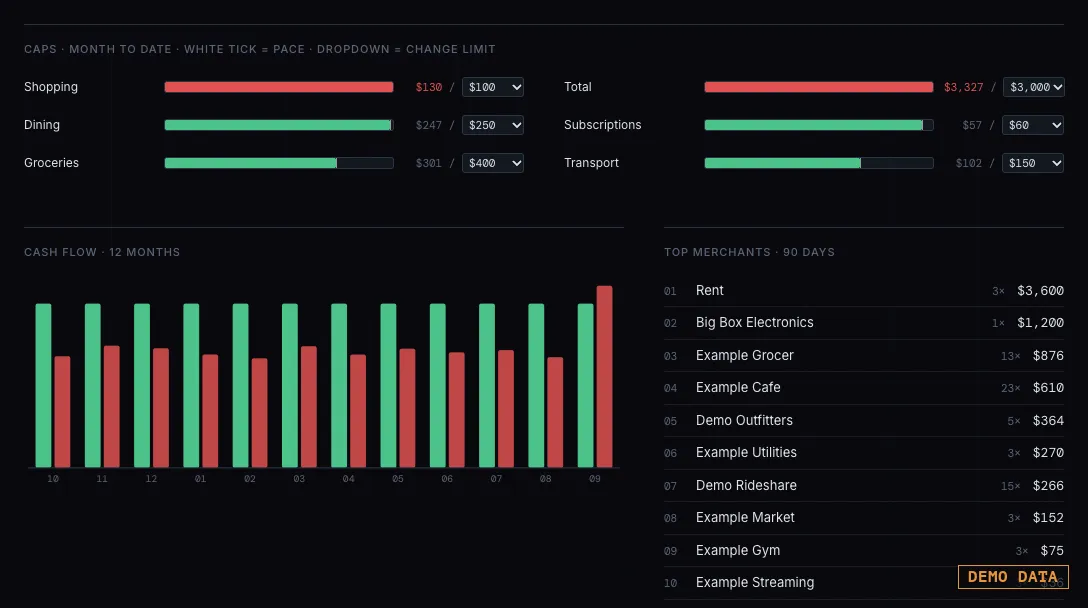
Six budget caps are graded ok, warn or over against month-to-date spend; two are over.
The spend simulator
On a phone
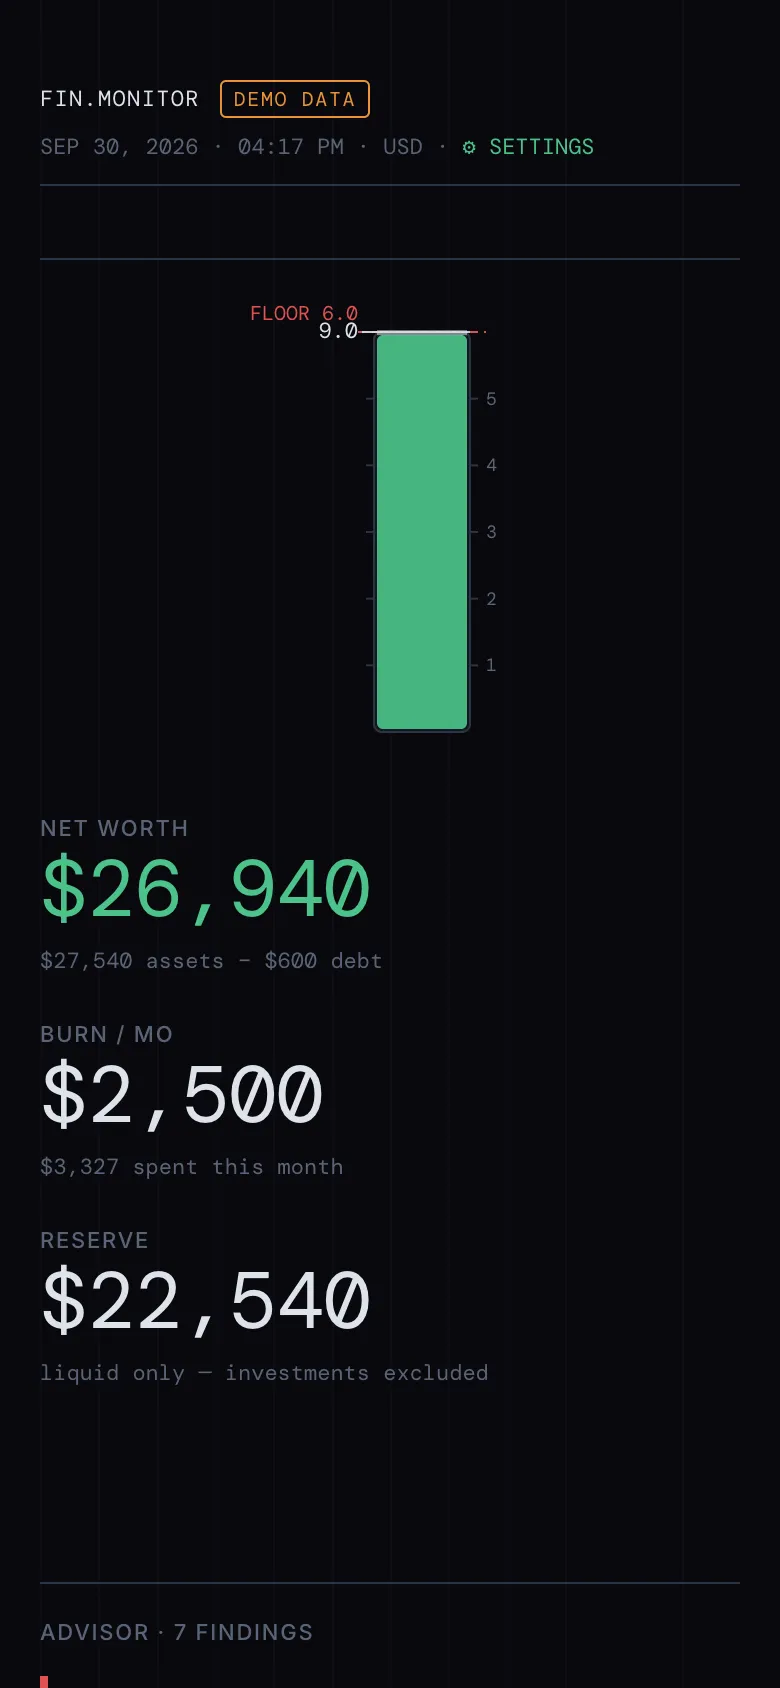
Where it's going
The full version is one local place for all my money, investments included: it syncs every account daily, flags what to act on, and answers whether I can afford something using totals, never account numbers.
- NowRunning on my MacOne local store, budget caps, a 9-rule advisor and an MCP server.
- Investment accountsBrokerage and crypto accounts join through their own adapters, in the same schema.
- Portfolio viewHoldings across every investment account, on one screen.
- Smarter advisorJudges unusual and wasted spending beyond fixed rules, and answers questions in plain words.